Next Market Crash Stocks Accumulate LIst
Friday, February 25, 2022
Tuesday, February 22, 2022

Tuesday, February 15, 2022

Saturday, February 12, 2022

Tuesday, February 08, 2022
RBA Likely to Raise Cash Rate Four Times by Year-End. Standby to Long AUD!!!
The Reserve Bank of Australia could raise interest rates four times in quick succession late in 2022 given the current upward trajectory of the economy, according to economist John Edwards, a former member of the central bank's policy-setting board.

Source
Monday, February 07, 2022
Jeremy Grantham says U.S. stocks are in a “super bubble"
“A two sigma is the kind of deviation that should occur every 44 years. Because we’re a little wilder and less efficient than we should be,it happens every 35 years. Every 35 years feels about right…one event in a career and twice in a lifetime.
Three sigma events should occur once every 100 years. Now we, as I like to say, do crazy pretty well as a species. Therefore, three sigma events occur much more often than they should, and they are out of kilter much more than two sigma events.
With two sigma events, you can have some reasonably standard bubbles. They give you a certain amount of pain in the minus 30, 40 to 50% area. Super bubbles can pretty much wipe you out like 1929. And that’s where we are now.”
– Jeremy Grantham,
Co-founder and Chief Investment Strategist of Grantham, Mayo, & van Otterloo (GMO)
"From an investment perspective, the picture to me is clear. Hedge long-biased equity exposure and/or raise cash. When the market reverts to the mean (the dotted blue line), that is a point in time when we can expect average nominal returns in the +/- 10% range. If you are sitting on a lot of cash, remain patient. The average trend line is around 2,500 in the S&P. That’s a pretty good target."---Steve Blumenthal

Source
Thursday, January 27, 2022
My Key Take-Aways From This Powerful 96-Years Return History For Common Stock Charts
My Key Take-Away From This Powerful 96-Years Return History For Common Stock Charts:
- All in the beginning of the new year when the last year returns down more than 30%.
For example, Y2008 followed by Y2009 up more than 20%. Y1974 followed by Y1975 up more than 20%. - This Year Y2022 return will be worst than Y2021 (Less than 20%). This chart shows that none of the yearly returns will be better than last year when last year's return was up more than 20%.

Source
Tuesday, January 25, 2022
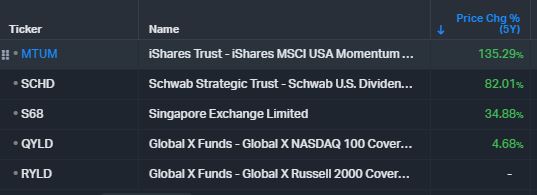
Hot Money flows to Singapore Market (STI Index) vs US Market (S&P 500) !!!
Hot Money flows to Singapore Market (STI Index) vs US Market (S&P 500) !!!
Bullish for STI.

Tuesday, January 11, 2022


Subscribe to:
Posts (Atom)