I realize some of you may be saying that a fixed fraction and a fixed ratio are the same thing. But, in fact, they are referring to two different subject matters and that is the difference. The fixed fractional method is referring to what percentage of your capital should you risk on the next trade, and every trade thereafter.
The Fixed Ratio method is referring to difference between each increase and decrease. This is the key. You will recall earlier in the article that I gave examples using average times to increase as well as average dollars to increase. Using the fixed fractional method, the time needed to increase at the beginning was far slower than the time needed to increase further into trading. The dollars required to increase contracts at the beginning was far more than the dollars required to increase contracts at higher levels. In all of the research, this was the flaw in the method, the fly in the ointment if you will. Fixed ratio corrected this flaw by simply making these differences EQUAL or FIXED.
For example, if it took an average of 10 trades to increase from one to two contracts, it will take an average of 10 trades to increase from 19 to 20 contracts. If it takes an average of $10,000 WITH THE FIRST CONTRACT to increase from 1 to 2 contracts, then it will take $10,000 PER CONTRACT to increase from 19 to 20 contracts. In other words, there is a Fixed Ratio of contracts traded to dollars required to increase. It goes like this. I call the ratio between contracts traded to dollars required the "delta". This simply means "change".
Depending on how aggressive or conservative you want to be, you simply change the delta in the following formula accordingly. A smaller delta is more aggressive while a larger delta is more conservative.
Current Balance + (#contracts * Delta) = next increase in contracts.
A $20,000 starting balance using a $5,000 delta would increase from 1 to 2 contracts once the account reached $25,000. To increase from 2 to 3 contracts, you would apply the same formula: Current Balance = $25,000 + (2 contracts * $5,000) = $35,000. You would increase to 3 contracts once the account hit $35,000. This continues throughout your increases.
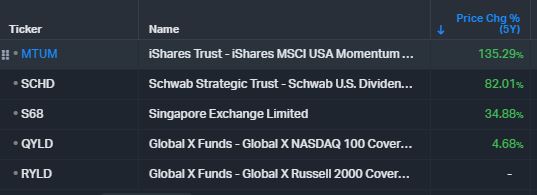
Next Market Crash Stocks Accumulate LIst
Sunday, March 23, 2014
Tuesday, December 25, 2012
Eric Sprott: Why Are Investors Buying 50 Times More Physical Silver Than Gold?
For the time being, the silver price is
essentially set in the paper market where the daily average trade on
the Comex is approximately 300 million ounces. An outrageous number
when you compare it to the daily mine production of about 2 million
ounces. As Bart Chilton, Commissioner of the Commodity Futures Trading
Commission stated on October 26, 2010, “I believe there have been
repeated attempts to influence prices in silver markets. There have
been fraudulent efforts to persuade and deviously control that price.
Based on what I have been told and reviewed in publicly available
documents, I believe violations to the Commodity Exchange Act have
taken place in the silver market and any such violation of the law in
this regard should be prosecuted.” Which brings us back to the phrase
“Follow the money.” In our view, it is almost inconceivable that
investors would allocate as many dollars to silver as they would to
gold, but that is what the data shows. The silver investment market is
very small. While the dollar value of gold in the world approaches $9
trillion, the value of silver in the forms of jewelry, coins, bars and
silverware is estimated at around $150 billion (5 billion ounces at $30
per ounce). This is a ratio of 60:1 in dollar terms. How long can
investors continue to buy silver at the current ratios when the
availability for investment is only 3:1? We are surprised that the
price of silver has remained at such a depressed level compared to
gold. Historically, the price ratio between gold and silver has been
16:1, when both were currencies. Today the ratio is 55:1, so what are
the numbers telling us? We believe this is one of those times when smart
investors will be well rewarded to “Follow the money.”
Submitted by Tyler Durden on 12/24/2012 - 16:37
Submitted by Tyler Durden on 12/24/2012 - 16:37
Sunday, March 11, 2012
Kelly Formula In Trading
Kelly % = W – [(1 – W) / R]
Where:
W = Winning probability
R = Win/loss ratio
The output is the Kelly percentage, which we examine below.
Putting It to Use
Kelly's system can be put to use by following these simple steps:
Access your last 50-60 trades. You can do this by simply asking your broker, or by checking your recent tax returns (if you claimed all your trades). If you are a more advanced trader with a developed trading system, then you can simply back test the system and take those results. The Kelly Criterion assumes, however, that you trade the same way you traded in the past.
Calculate "W", the winning probability. To do this, divide the number of trades that returned a positive amount by your total number of trades (positive and negative). This number is better as it gets closer to one. Any number above 0.50 is good.
Calculate "R," the win/loss ratio. Do this by dividing the average gain of the positive trades by the average loss of the negative trades. You should have a number greater than 1 if your average gains are greater than your average losses. A result less than one is managable as long as the number of losing trades remains small.
Input these numbers into Kelly's equation: K% = W – [(1 – W) / R].
Record the Kelly % that the equation returns.
Free CD Reveals How to Successf
Read more: http://www.investopedia.com/articles/trading/04/091504.asp#ixzz1omxshZkv
Sunday, February 12, 2012

Tuesday, April 12, 2011
Subscribe to:
Posts (Atom)