
Next Market Crash Stocks Accumulate LIst

Friday, June 19, 2020
Another Good Approach : When To invest S&P 500 ?

Conclusion from the chart, whenever markets have declined over 30% from the 3 years moving average ( Green Color ), that has usually been a very good buying opportunity
Wednesday, June 17, 2020
When to Invest S&P 500 ?

Follow up from my following last post :
http://jimmytradingroom.blogspot.com/2020/06/is-s-500-over-price.html
If you invested S&P 500 at current Price 3114, based on above table historical performance, your investment both Avg 5 Years and 10 Years return likely will be Negative !
Good time to start invest in S&P500 is when PE is less than 20.
Tuesday, June 16, 2020
When To Sell Your Bond Investment ?

Current landscape is good for Bond investment, but you still need to stay alert as risk can suddenly shoot up if dollars starts to weaken and inflation starts to pick up.
With a $25 trillion debt level in US, every hundred basis point increase in interest rates is a $250 billion increase in cost.!!!
Sell your Bond investment when US Dollars starts to Weaken, and Inflation starts to Pick up !!!
Monday, June 15, 2020
Are We In a Recession or a Depression?
Are We In a Recession or a Depression?
Look like we are more in Depression than Recession with following key points :
- A recession is the part of the business cycle that cleans the system from the excesses of the previous expansion. And a recession usually last only less than one year, and it does not really change the thinking and behavior of the economic subjects.
- A depression is different . A depression lasts longer than one year and it goes deeper. In depression there is a secular changes in consumer spending and saving, and deflation usually follow by stagflation
New Sustain behavior ? I think is likely, not only in US also for many other countries..

- From the early 50s to the early 90s, the world population between zero and 65 years old grew by about 25 million per year. We declined to zero in 2018. Now we are negative and it will be shrinking down to 12 million negative growth into the early 2030’s.This creates a much different background for economic growth than what we had previously.
- The corporate sector that has more debt than ever around the world, they had to borrow to pay all the expenditures. The deficit is the US was about $500 billion last year. Corporations now they have to repair the balance sheet. Richard Koo called it the Balance Sheet recession when Japan entered the Big Depression in 1990
My Conclusion, it all depends on how respective countries governments react going forward..... As an investor, we should assume we are in the Depression for any investment decision...
During the1930 Great Depression the savings rate rose from a de facto 0% to 28%, even long after GDP had bottomed out. It is often forgotten that the Depression did not end until 8 years after GDP had reached its lowest point (1933). The stock market did not exceed the highs of 1929 until 1958.
I Think this time we are in better position than 1930, but likely it still take more than 2 years to recover.....
What makes a depression different than a recession is that a depression ushers in many years of secular change in behavior. Recessions do not.---Dave Rosenberg
Sunday, June 14, 2020


Is S&P 500 Over Price ?
Is S&P 500 Over Price ? Let do a Simple Analysis:
Following is a history of earning from NYU published the chart below on Jan 5, 2020. Please take note Y2019 actual earning is $139.4 and not $162.35 the forecast predicted
What happen in 2008 subprime crisis ? it drop from $82.54 to $42.51...33.9% !
This year most likely it will drop more than Y2008 33.9%, but let assume we just use 33.9% drop from Y2019 earning of $139.4 to estimate this year earning.
The projected this year earning will be $139.4 - ($139.47*33.9%) = $92.3
Refer to the S&P 500 PE Ratio - 90 Year Historical Chart,
Let use 14 PE to estimate the S&P 500 fair value.. 14*92.3 = 1292.
Today S&P 500 Price 3041
You can estimate S&P 500 next year earning and PE, and decide yourself at what price you think is value investing..
S&P 500 PE Ratio - 90 Year Historical Chart


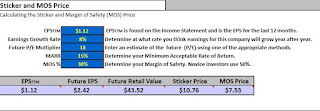
OCBC BANK Margin Of Safety (MOS) PRICE
Quick Analysis on OCBC Bank MOS Price to start Accumulate :
MOS PRICE $7.53 ( Y2019 Tangible Book Value $9.74 )

OCBC Bank 5 years Tangible Book Value Growth Rate is 8.45%

 Risk :


MOS PRICE $7.53 ( Y2019 Tangible Book Value $9.74 )

OCBC Bank 5 years Tangible Book Value Growth Rate is 8.45%

- Can OCBC bank sustains the last 5 years book value growth rate of 8.45% ?
- OCBC Bank last 5 Years EPS growth is only 1.73% vs UOB 5.18%, and DBS Bank 8.92%
- How Blockchain technology impact future banking revenue ........etc


Subscribe to:
Posts (Atom)