
Next Market Crash Stocks Accumulate LIst

Sunday, June 14, 2020

Is S&P 500 Over Price ?
Is S&P 500 Over Price ? Let do a Simple Analysis:
Following is a history of earning from NYU published the chart below on Jan 5, 2020. Please take note Y2019 actual earning is $139.4 and not $162.35 the forecast predicted
What happen in 2008 subprime crisis ? it drop from $82.54 to $42.51...33.9% !
This year most likely it will drop more than Y2008 33.9%, but let assume we just use 33.9% drop from Y2019 earning of $139.4 to estimate this year earning.
The projected this year earning will be $139.4 - ($139.47*33.9%) = $92.3
Refer to the S&P 500 PE Ratio - 90 Year Historical Chart,
Let use 14 PE to estimate the S&P 500 fair value.. 14*92.3 = 1292.
Today S&P 500 Price 3041
You can estimate S&P 500 next year earning and PE, and decide yourself at what price you think is value investing..
S&P 500 PE Ratio - 90 Year Historical Chart


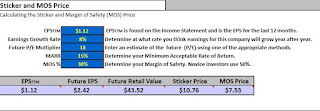
OCBC BANK Margin Of Safety (MOS) PRICE
Quick Analysis on OCBC Bank MOS Price to start Accumulate :
MOS PRICE $7.53 ( Y2019 Tangible Book Value $9.74 )

OCBC Bank 5 years Tangible Book Value Growth Rate is 8.45%

 Risk :


MOS PRICE $7.53 ( Y2019 Tangible Book Value $9.74 )

OCBC Bank 5 years Tangible Book Value Growth Rate is 8.45%

- Can OCBC bank sustains the last 5 years book value growth rate of 8.45% ?
- OCBC Bank last 5 Years EPS growth is only 1.73% vs UOB 5.18%, and DBS Bank 8.92%
- How Blockchain technology impact future banking revenue ........etc


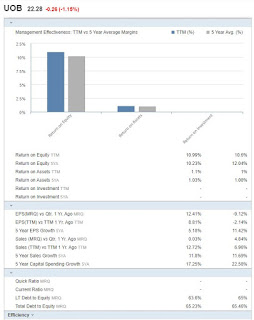
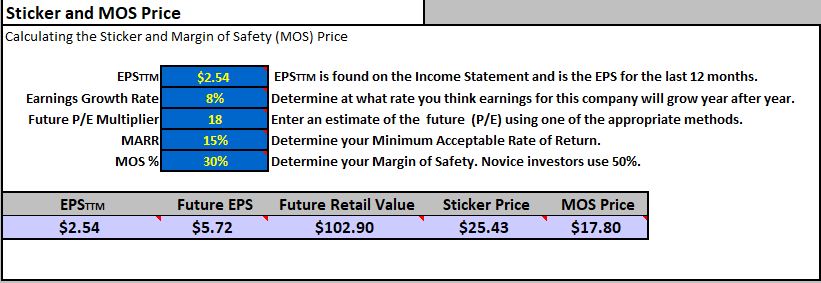
UOB BANK Margin Of Safety (MOS) PRICE
Quick Analysis on UOB Bank MOS Price to start Accumulate :
MOS PRICE $17.8 ( Y2019 Tangible Book Value $21.27 )
 UOB Bank 5 years Tangible Book Value Growth Rate is 8.45%


Risk :

MOS PRICE $17.8 ( Y2019 Tangible Book Value $21.27 )

Risk :
- Can UOB bank sustains the last 5 years book value growth rate of 8.45% ?
- UOB Bank 5 Years EPS growth is 5.18% vs DBS Bank 8.92
- How Blockchain technology impact future banking revenue ........etc


Subscribe to:
Posts (Atom)